
Here are a series of videos I did in my trusty ol’ Zoom Room about rational functions. The PDFs I use in my sharescreens are my own creations, with the exception of the artworks on them, which are complements of google images and meme makers. They used to be Promethean slides, which is why they sometimes look a bit skewed. Each video is one lesson in a unit on rational functions that I would normally teach in a classroom full of students. So what’s missing here is the other voices–it feels strange for me to just babble on without interruption. I encourage my students to interrupt me with questions, and they do, constantly. These lessons are normally much more of a dialogue than a lecture.
Tag: math
Seeing Patterns in the Graphs of Shifting Functions with Desmos

This is a walkthrough of the basic principles covered by my famous (in my school, anyhow) Mother Function Project. The student handout is linked in the sidebar (or at the bottom if you’re on the mobile site) under the Links to Math Lesson Plans menu. Yes, I know that we call them “parent functions” now. But I teach middle school, and the sly snickers I get when I say “Mother FUNCTION!” are priceless. Let math teachers have our fun!
Normally, I would not be going over all the observations with the students beforehand. The video models the thinking I hope that they achieve by the end of the project. And in this particular case, the video was made during remote instruction for those who didn’t manage to make it to the original zoom lesson, or who really struggled with the concept (I had to have a sub teach it this year).
Usually, this exploration/assessment comes near the end of the year, after they have studied all these function types in their own right. Then I ask them to do this:
You will be creating a series of graphs in Desmos, importing them into a google doc, and reflecting on the changes after each graph. The final project will be submitted to me both digitally and as a paper document that you have printed and highlighted.
Requirements:
- Each graph will contain two functions: the mother function, and the second, related function.
- Each of the two graphs in each image should be labelled with its equation, including the mother function, each time.
- Each graph will be followed by a sentence or two about what changed from the mother function to the related function.
“The related function is shifted to the left 5, and is increasing faster.”

So the observations you see me making in my video are the kinds of observations that I want my students making independently. The goal here is to get them to see that across all function types, when you do certain things to the equation of their parent function, the graph changes in predictable ways. For example, adding a negative sign to the coefficient of the first term of any of these functions causes the graph to “flip.” Adding +3 or -5 at the end causes the graph to shift up or down 3 or 5, respectively.
To ensure that they get a good look at all the shifts, I provide a list of functions for them to graph:
Functions:
Linear mother function: y=x
- y=2x
- y=x+4
- y=-x
- y=1/2x
Quadratic mother function: y=x2
- y=x2+3
- y=x2-4
- y=½x2
- y=3x2
- y=-x2
- y=-3x2
Square Root mother function: y=sqrt(x)
- y=3(sqrt(x))
- y=-(sqrt(x))
- y=sqrt(x+6)
- y=sqrt(x-4)
- y=sqrt(x)+2
- y=1/4(sqrt(x))
Exponential functions: y=abx (we will use y=2x as our mother function)
- y=2(2x)
- y=1/6(2x)
- y=-2(2x)
- y=2x-5
- y=2x+4
The idea here is that they will have seen what happens in each type, and they will see the commonalities. Part of the challenge of this project is that they students need to use accurate, descriptive language and appropriate mathematical vocabulary. So believe me when I say that my jaw feels like it’s going to fall off from the number of times I have to say, “Parabolas don’t have a slope! At least not till you have to calculate the slope of a line tangent to it at a point, and that’s not until calculus! Slope is for lines! It even has its own special formula! Use another word!”
After they write their observations, I challenge them with some questions:
- What happens to a mother function when you add or subtract a number on the end (not under a radical)?
- What happens to a mother function when you multiply it’s first term (x2, or sqrt(x), or x, or b) by a whole, positive number?
- What happens to a mother function when you multiply its first term by a negative number?
- What happens to a mother function when you multiply its first term by a fraction that is between -1 and 1?
This forces them to really look at their observations and synthesize an over-arching theory of what changing the equation does to a graph.
In the linked worksheet, you may notice that I ask my students to complete a problem set on a textbook page. This can be any problem set in which students are given an equation, for example y=-2x2 – 3, and asked how it will shift from the mother function, y=x2. They should be saying things like, “The parabola narrows because the coefficient is less than -1. It will be upside down because it has a negative leading coefficient. It will be shifted down three, and it’s y-intercept will be (0,-3).”
It is also useful to hold a peer-review session before we turn these in. Students read each others’ work and discover all kinds of new ways to think about the shifting graphs. They also catch each others’ mistakes, resulting in a better learning experience overall. I don’t consider this “cheating.” Learning happens in math when we have math dialogues. The end result is that the student who made a mistake talked about it with a peer, hopefully understood better, fixed it, and learned something. And if they learned something, then their grade should reflect that.
Another great thing about this lesson is that it also covers both criteria B and C for IB MYP mathematics. (That’s pattern recognition and communication, respectively. And IB MYP is International Baccalaureate Middle Years Programme. Yes, with an e. I don’t make the rules of international spelling.)
I look forward to teaching this lesson all year. Not just because I get to holler, “Hey! Look at the asymptotes on that mother function!” every few minutes, but because it puts so much of the learning on the students. The direct instruction you see in the video is so much less effective than when they figure it out for themselves. When they make these connections without being directly told, they are building knowledge and understandings that are deeper, more meaningful, and stick with them for a long time.
Using the Formula for Volume to Engage Critical Thinking, Build Pattern Recognition Skills, and Strengthen Resilience

The ability to see mathematical patterns is one of the four main strands upon which IB Middle Years Programme students are assessed. This pattern-finding activity is one of my favorites, because it encourages them to extend their thinking past what they’ve been taught and to take risks by trying out their ideas.
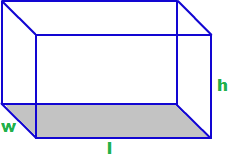
First, I make sure that they’re all comfortable with the formula for the volume of a rectangular prism, as well as the formulas for the areas of circles and triangles. The goal here is to get them to see that all volume formulas for prisms (and cylinders) have the same basic setup: you find the area of its base, and then you multiply that by the height.
This may seem obvious to people who already have this content in their mental databases. But let me assure you–it is NOT obvious to most students to whom I assign this task. What task? Well, this one:
1) So you know how to find the volume of a rectangular prism. Go ahead and tell me how you do that.
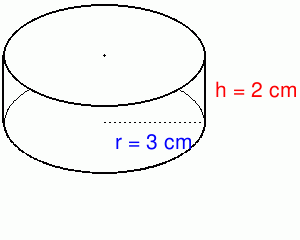
2) Now you’re going to use what you know about finding the volume of rectangular prisms and apply it to a cylinder. How would you find the volume of this cylinder? Please use a combination of math and writing to explain.
For rectangular prisms, some of the students just plug in the numbers and multiply. No matter how many times I may have emphasized that volume is the area of the base times the height. (I sometimes explain this as the number of rooms on the ground floor of a building times the number of stories it has is the total number of rooms–in other words, its volume.)
But they often don’t consider this. They have a system that works! Multiply those three numbers and they get it right! Why worry about the other stuff? So when they hit that cylinder question, many of them freak out–where is the third number?
This is where it’s important to have built into your classroom culture a feeling that it is not only okay to struggle, but that the struggle IS THE LEARNING. Students must understand that they aren’t expected to know this off the top of their heads. This isn’t regurgitation, and it isn’t even practice of a new skill. This is creating knowledge for yourself in a way that makes sense to you.
So. How do they know if their idea for the formula for volume of a cylinder is correct?
They don’t–yet. They write down their idea for what it might be, they do their calculations using their formula, and then I give them this task:
4) The volume of the cylinder below is about 502.4 cm3. Use this to test your formula. Does it work? If not, revise it. You may use a calculator for this section, but must show your work.
Giving students the answer allows them to try out their idea. If the formula they created doesn’t work–and they test it more than once to make sure it isn’t just a typo on their calculator–then they know that they need to go back to the drawing board and re-examine their thinking.
That’s a lot for 11-13-year-olds to handle sometimes, so it’s important at this stage to be their cheerleader. If by this point in the year they have heard you chant “Fail Forward!” and “FAIL=First Attempt In Learning!” then they are far less likely to put their head down on their desk and give up. I also bolster them with pointed questions.
“Notice how I shaded the base of that rectangular prism? Maybe that’s a hint.” or “How are a rectangular prism and a cylinder the same? What measurements do they both have?”
Eventually, everyone catches on. And the light in their eyes when they realize that they just taught themselves the formula for the volume of a cylinder is priceless. They not only see that their perseverance paid off, but they also learn to trust in the process of thinking, trying, revising, trying again. They learn that they are more capable than they previously thought.
Then, once their confidence is a little built up, I hit them with this:
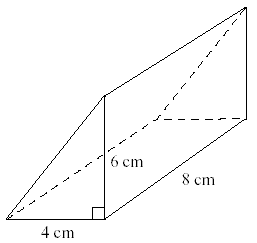
5) Now, apply what you know to a new situation. How would you find the volume of this triangular prism? Use a combination of math and writing to explain.
This one is tricky, because the “base” isn’t on the bottom. But it’s also great, because there are two ways students can visualize this to get to the right answer: they can either think in the same way as the previous two about how the area of the base (now a triangle) times the height is the volume. Or they can think, “Hey, this is just half a rectangular prism, so I’m going to take that formula and cut it in half.” Either way shows good critical thinking. I let them test their formula, of course:
7) The volume of this triangular prism is 173.25 cm3. Use this to test your formula. Does it work? If not, revise it. You should use a calculator for this section, but you must show your work.
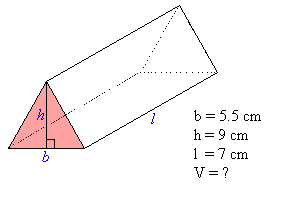
Same deal as before. But the additional difficulty is that they have to understand that b isn’t the AREA of the base. And h isn’t the height of the full prism, just of the base. More opportunities to force them to really think about their moves, here.
Finally, we want to tie it all together. I ask them to write me a little paragraph:
8) How are all the formulas for volume the same?
This one can be tricky even for those students who understood the math. Every now and then, they think that the answer is too easy, and it couldn’t possibly be the answer. However they handle it, I will usually look over their work as they hand it in, and return it if they don’t quite have a clear statement about their thinking.
To round out this lesson/exploration/assessment, I usually have the students share their own experience with each other. Lots of pride and relief all around, as well as an opportunity to see these equations through a different thought process.
And that’s it! This is one of my favorite power lessons, because it hits so many learning goals, not just in terms of math content, but in terms of emotional regulation and critical thinking. It takes a lot of stick-to-it-ness to get through this lesson, and I always emphasize to my students that they’re amazing for being the latest class to prove how awesome they are by honing the fine steel of their minds in the forges of struggle.
