

So thrilled to have given my talk, The N00bHacker’s Guide to the InfoSec Galaxy this year at The Diana Initiative! I created a resource for newbies like myself to gain knowledge through gamified and free resources available online. In addition, there was a fun challenge running through the talk–so if you need another gander to find all the hidden clues, or if you just want to get a look at these great resources, here is a link to the presentation. Happy Hacking!
US Cybercom Valentine’s Day Crypto Challenge 2021 #9 Walkthrough–Spoilers Ahead!

Okay, it is in the title, but it’s worth saying again. IF YOU HAVE NOT SOLVED THIS AND DON’T WANT TO KNOW HOW, DON’T READ ON.
On Valentine’s Day, US Cyber Command put out a fun set of 11 puzzles for cryptography enthusiasts to sink their brains into. I’ve been working on them since, and have managed to solve five so far. I have had help along the way, mind you, a nudge here and there from other puzzle-solvers. I appreciate the way the community gives hints but not solutions when you’re trying to figure it out on your own. Which is why I am again warning anyone who doesn’t want the answer just given to them to LEAVE NOW. Because I am about to describe the solution to puzzle #9. Which was an onion inside a rabbit hole inside an onion. I learned a lot doing it, and I want to share.
The link to puzzle #9 goes to this adorable .png file.

Daww. Corgo hab a heart. I first examined the upper left and lower right corners to see if any pixels looked like they weren’t uniform, which can indicate hidden data. Nope. Next, I opened it in a hex editor. HexEd.it, to be exact. An earlier challenge had some plain text encoded into the .png file (I will talk about that one later) and so I hoped for a similar buried clue. No plain text. I scrolled AAALLLLL the way down, just to be sure.
And I noticed something funny. All the ASCII characters after a certain point looked…weird. Sort of uniformly weird. And maybe it was nothing, but I scrolled up to see where the change happened from normal .png garblebabble to wierd-lookin’ garbledygook.

It happened right after the IEND. Which in a .png file, is supposed to be the end of file marker. Huh.
So I google “.png IEND hidden data.” And lo and behold–that’s a steganography technique. File that knowledge away for future CTFs. COOL! I was on the trail! Now I uh…Now I–
I didn’t know what the heck to do. I knew where the data WAS. I didn’t know what to do with it. A more technical person pointed out that the hex editor I was using wasn’t really able to do what I needed to do, which was delete out all the legitimate .png data, leaving only the hex for the hidden file. After downloading the recommended hex editor, I was able to actually manipulate the data, and ended up with just the hex string that was after the file. This is a technique used in digital forensics to identify and access hidden data. As I moved my cursor around the hex, it became apparent that this was lots and lots of emoji. (It was apparent because the hex editor had a UTF-8 field, and the emoji showed up there one at a time as I moved my cursor to the accompanying hex code.)

That made sense. Puzzle #9 came with a Key.
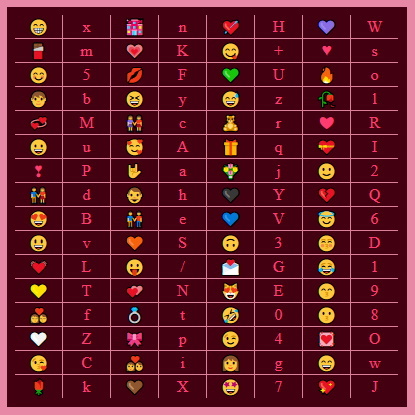
Okay! So I had pulled the file out of the original .png, and now I could decode it! I started right away with my trusty notebook and pencil. Until I realized something super obvious about four emoji in. There were a LOT of emoji. So. Many. Emoji. Hundreds–nay, thousands. There was no way this was as simple as a substitution cypher right into plaintext. The clue was only 30 characters long. There were 64 emoji on the key. There were pages and pages of emoji in my hex editor.
Okay. So I found an online hex-to-UTF-8 converter. Copied the hex from my editor, and pasted it in the little window. Hit convert. BAM! A huge long string of emoji. Pages and pages and pages of them. I copied and pasted them into a Google doc.

I got to work. The find and replace function and I became best friends as I manually did 64 find and replaces, one for each of the emoji. And some of those things were REALLY similar. An emoji that was a smiley with round eyes vs. an emoji what was a smiley with oval eyes. Luckily, I spotted that one before I caught myself replacing the wrong character! Look at “u” and “v” on the key up there. Whew. Finally, it was done. I had a string of 64 characters instead of smileys.
It ended with an = sign, and that combined with the fact that there were 64 characters could mean only one thing: these emoji had turned into a Base64 file. (Thanks to a friend for helping me make connections on this one!) Base64 is an encoding method that takes binary data and turns it into ASCII characters. It is useful when you need to send binary data across channels designed for text content. Emails make heavy use of it. An = at the end is used to pad out a string that needs to be a certain length.
Okay, so it was definately Base64 here. I toodled over to this MAGIC website called base64.guru. Go take a look. Seriously, it’s glorious. And I tried to convert the base 64 into ASCII. It gave me an error saying that this was a gzip file type.
Iiiiiinteresting! I had literally never heard of a gzip file before. I assumed it was some kind of compressed file format, and looked it up on Google. Turns out it is a very old–as the internet goes–file type and software for compressing data. Its still in use today even though there are more efficient compression algorithms, because it uses less processing power. It is used in HTTP compression. It first was invented in 1992!
Okay, so luckily that same website I was using could convert base64 strings into gzip files. I did so, and downloaded the result.
How to open a gzip file? With 7zip. But how to open the contents of the file that was unzipped? Only a few applications were offered. One of them was Firefox. I opened it. It was hearts. Hundreds of thousands of black and white hearts.

Okay, so clearly on the right track, but what was the point of this? I zoomed out a bit to see if there was any order to the chaos. It…did look like something was up. I tried narrowing my window to get the rows to line up, but was never successful.
So I zoomed out even farther.

I still couldn’t make out what it was supposed to be, however. I had tried opening it in notepad with the same results. Couldn’t get far enough out. Then someone on reddit (Thank you /r cryptography!) suggested I try a text editor instead. Opening it in VSCode gave me:

That’s a QR code!!!
But how to see the whole thing? This part took me a really long time, I have to admit. Later, I asked a friend who also solved it how he did it, and he basically deleted all the whitespace and replaced the black hearts with a smaller character. I, however, didn’t think of that. I went oldschool.
Opening the file in Notepad++ (thank you to my partner who introduced me to this little gem of a program), I was able to zoom way out and get screenshots–6 of them–that covered the whole QR code.

Then I actually went into MS Paint and PAINSTAKINGLY cut and pasted them together. The result was fuzzy, and I spent more time than I care to admit making it pretty with pixel tools. I was unaware, you see, of how forgiving these codes are. I will not show a picture of the finished code here, but suffice it to say that my MS Paint skills were still sharp enough to make this work. I read the QR Code using an app on my phone. It resolved into a message:
Heartbroken? Have you tried subtracting your hearbreak 💔 ?
And then there was ANOTHER string of emoji. WordPress will not let me paste them in without putting each one as a separate paragraph, so I won’t bother. Most of them had to do with AV stuff: Speakers🔈🔉🔊🔇, phones 📵, videocasettes 📼, camcorders 📹, cameras 📷, DVD’s 📀, and–for some reason–yen💴? And a couple of magnifying glasses🔍 and reversal arrow things 🔂🔃. Immediately I detected the typo “hearbreak” and thought that maybe the muted speaker emoji 🔇 would be a “hearbreak.” But poring over reddit for ideas later on, someone said they solved it without noticing the typo. Hmm. So much for that theory.
It honestly took me a few days to make progress on this one. I tried subtracting the heartbreak emoji from the original long Base64 file. I didn’t have much hope of this being the right direction–it’s unlikely that there would be an entire huge file that didn’t use the letter Q. As expected, it rendered the data useless. Also, it didn’t make sense to give new emoji if I was just going to ignore them.
I put the message in my trusty Hex editor, and tried subtracting any hex pair that made up the heartbreak emoji. This pretty much caused the remaining data to be useless again. Just subtracting the hex for the heartbreak emoji just cut the single emoji from the message, of course. How did one subtract heartbreak then, in a way that would alter the code to help reveal something?
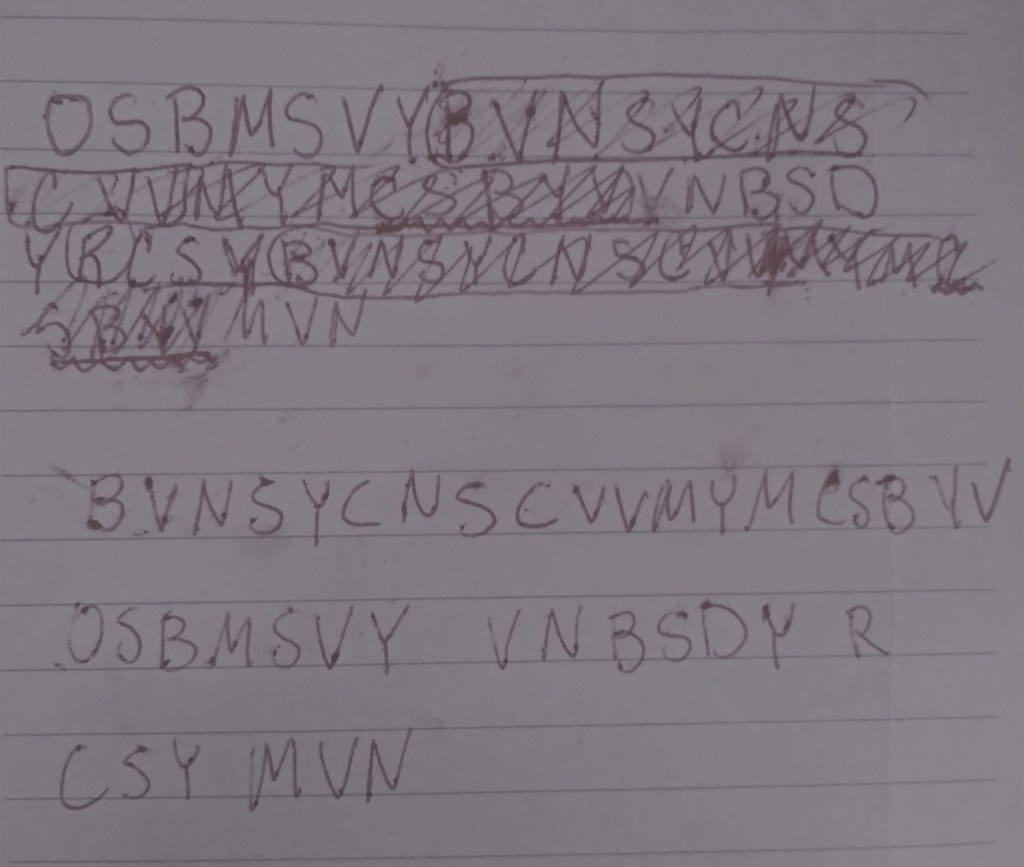
I actually resorted to just analyzing the emoji themselves–I saw a pattern that repeated itself. Clearly, there was a simple substitution code at play here. But with no way of knowing what letters they were, or where word breaks were, I was pretty well stuck.
Finally, some kind soul on /r cryptography gave me the hint that tipped my brain into the right direction. I had actually awakened myself from slumber an hour early with an idea about subtracting the heartbreak emoji’s UTF-8 code from the UTF-8 code of the others, to see what I got. But with a groggy brain, I realized with dismay that I couldn’t subtract letters.
Yeah. It had been a long week. I teach algebra and should know better. The kind hinting fellow basically confirmed what I had been thinking, and suddenly my palm hit my forehead at high speed. I couldn’t subtract the UTF-8 encoding IN ITS CURRENT FORM. Hello, my friend RapidTables.
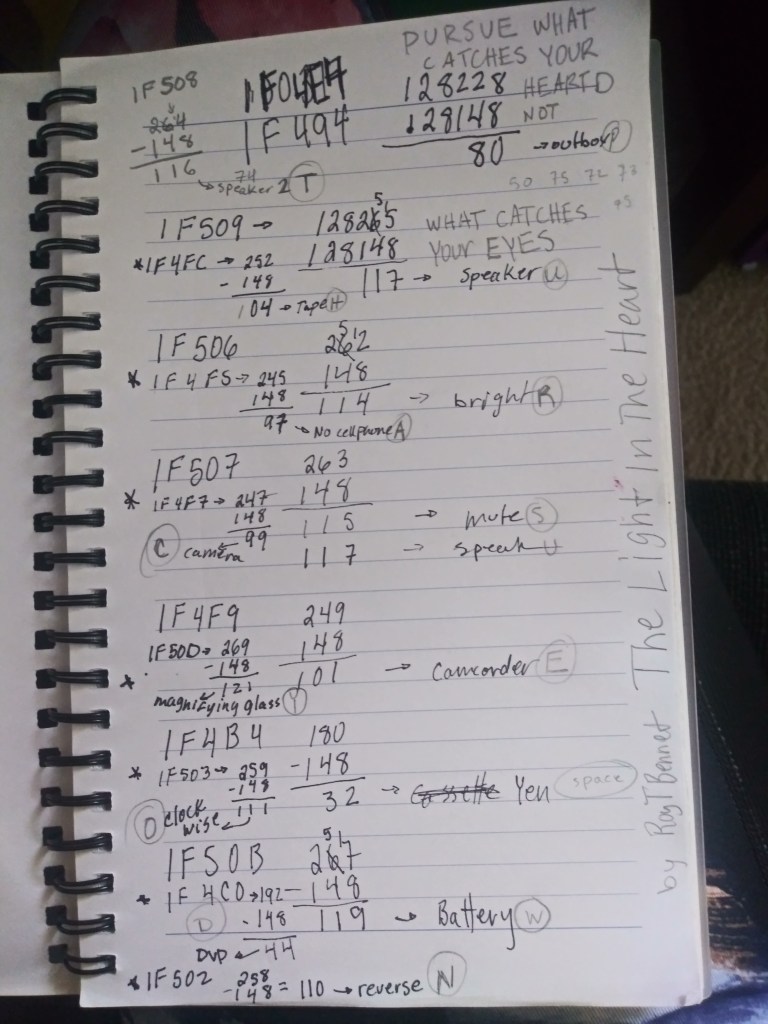
I converted the UTF-8 hex string into decimal for the heartbreak. Then I did the same for the first emoji, which was an outbox 📤. 1F04E4-1F494 in hex is 128228-128148 in decimal. And it equals 80. I hopped onto another tab of RapidTables, and started converting hex to ASCII. 80 is a “p.” Now we were cooking with gas. I calculated each emoji by hand as I went.
And I got it.
But the phrase it generated wasn’t 30 characters and five words long, as the original solution was supposed to be. It was more than twice as long. Egads, another puzzle?!
I googled the phrase I got. It turns out it was from a book called The Light In The Heart. Not bothering to count letters, I was excited to note that the title had five words! I had done it! I entered the title into the URL that would take me to the reward if it were correct–and it was wrong. Ugh. Grr.
I carefully read the decoded phrase again. “Pursue what catches your heart, not what catches your eye…” Well. Um. The first half of it was five words. I tried it.
VICTORY! I almost cut up bits of paper so I could throw confetti on myself.
This one was a bear. It took me a couple of weeks and some nudges from friends to really get there, and I learned so much along the way. Like, for example, that Base64 strings are padded with equal signs. How to unzip a gzip file. Notepad++ is way better than regular Notepad. And I stumbled upon (and was guided towards) several new tools that I have found invaluable: HxD, Notepad++, RapidTables, and Base64.guru. I have used them to solve at least three other challenges since. I am so grateful to the game designers for this super fun opportunity to practice and expand my skills!
Video Playlist about Rational Functions for Algebra 1-2
Here are a series of videos I did in my trusty ol’ Zoom Room about rational functions. The PDFs I use in my sharescreens are my own creations, with the exception of the artworks on them, which are complements of google images and meme makers. They used to be Promethean slides, which is why they sometimes look a bit skewed. Each video is one lesson in a unit on rational functions that I would normally teach in a classroom full of students. So what’s missing here is the other voices–it feels strange for me to just babble on without interruption. I encourage my students to interrupt me with questions, and they do, constantly. These lessons are normally much more of a dialogue than a lecture.
Seeing Patterns in the Graphs of Shifting Functions with Desmos

This is a walkthrough of the basic principles covered by my famous (in my school, anyhow) Mother Function Project. The student handout is linked in the sidebar (or at the bottom if you’re on the mobile site) under the Links to Math Lesson Plans menu. Yes, I know that we call them “parent functions” now. But I teach middle school, and the sly snickers I get when I say “Mother FUNCTION!” are priceless. Let math teachers have our fun!
Normally, I would not be going over all the observations with the students beforehand. The video models the thinking I hope that they achieve by the end of the project. And in this particular case, the video was made during remote instruction for those who didn’t manage to make it to the original zoom lesson, or who really struggled with the concept (I had to have a sub teach it this year).
Usually, this exploration/assessment comes near the end of the year, after they have studied all these function types in their own right. Then I ask them to do this:
You will be creating a series of graphs in Desmos, importing them into a google doc, and reflecting on the changes after each graph. The final project will be submitted to me both digitally and as a paper document that you have printed and highlighted.
Requirements:
- Each graph will contain two functions: the mother function, and the second, related function.
- Each of the two graphs in each image should be labelled with its equation, including the mother function, each time.
- Each graph will be followed by a sentence or two about what changed from the mother function to the related function.
“The related function is shifted to the left 5, and is increasing faster.”

So the observations you see me making in my video are the kinds of observations that I want my students making independently. The goal here is to get them to see that across all function types, when you do certain things to the equation of their parent function, the graph changes in predictable ways. For example, adding a negative sign to the coefficient of the first term of any of these functions causes the graph to “flip.” Adding +3 or -5 at the end causes the graph to shift up or down 3 or 5, respectively.
To ensure that they get a good look at all the shifts, I provide a list of functions for them to graph:
Functions:
Linear mother function: y=x
- y=2x
- y=x+4
- y=-x
- y=1/2x
Quadratic mother function: y=x2
- y=x2+3
- y=x2-4
- y=½x2
- y=3x2
- y=-x2
- y=-3x2
Square Root mother function: y=sqrt(x)
- y=3(sqrt(x))
- y=-(sqrt(x))
- y=sqrt(x+6)
- y=sqrt(x-4)
- y=sqrt(x)+2
- y=1/4(sqrt(x))
Exponential functions: y=abx (we will use y=2x as our mother function)
- y=2(2x)
- y=1/6(2x)
- y=-2(2x)
- y=2x-5
- y=2x+4
The idea here is that they will have seen what happens in each type, and they will see the commonalities. Part of the challenge of this project is that they students need to use accurate, descriptive language and appropriate mathematical vocabulary. So believe me when I say that my jaw feels like it’s going to fall off from the number of times I have to say, “Parabolas don’t have a slope! At least not till you have to calculate the slope of a line tangent to it at a point, and that’s not until calculus! Slope is for lines! It even has its own special formula! Use another word!”
After they write their observations, I challenge them with some questions:
- What happens to a mother function when you add or subtract a number on the end (not under a radical)?
- What happens to a mother function when you multiply it’s first term (x2, or sqrt(x), or x, or b) by a whole, positive number?
- What happens to a mother function when you multiply its first term by a negative number?
- What happens to a mother function when you multiply its first term by a fraction that is between -1 and 1?
This forces them to really look at their observations and synthesize an over-arching theory of what changing the equation does to a graph.
In the linked worksheet, you may notice that I ask my students to complete a problem set on a textbook page. This can be any problem set in which students are given an equation, for example y=-2x2 – 3, and asked how it will shift from the mother function, y=x2. They should be saying things like, “The parabola narrows because the coefficient is less than -1. It will be upside down because it has a negative leading coefficient. It will be shifted down three, and it’s y-intercept will be (0,-3).”
It is also useful to hold a peer-review session before we turn these in. Students read each others’ work and discover all kinds of new ways to think about the shifting graphs. They also catch each others’ mistakes, resulting in a better learning experience overall. I don’t consider this “cheating.” Learning happens in math when we have math dialogues. The end result is that the student who made a mistake talked about it with a peer, hopefully understood better, fixed it, and learned something. And if they learned something, then their grade should reflect that.
Another great thing about this lesson is that it also covers both criteria B and C for IB MYP mathematics. (That’s pattern recognition and communication, respectively. And IB MYP is International Baccalaureate Middle Years Programme. Yes, with an e. I don’t make the rules of international spelling.)
I look forward to teaching this lesson all year. Not just because I get to holler, “Hey! Look at the asymptotes on that mother function!” every few minutes, but because it puts so much of the learning on the students. The direct instruction you see in the video is so much less effective than when they figure it out for themselves. When they make these connections without being directly told, they are building knowledge and understandings that are deeper, more meaningful, and stick with them for a long time.
Using Scratch to Teach Algebra and Computer Science Basics
https://scratch.mit.edu/projects/383312760/embed
When we had to go to remote schooling due to COVID-19, the expectations for what we would be able to teach were dramatically scaled back. All the stuff I had been doing in person was not going to work in a virtual setting. I had to let go of my expectations for how the year would go, and try to look at this new development in a different light. I had to think not about what we were not going to be able to cover in the remaining time, but about what opportunities this new set-up would provide us. So I asked myself:
What have I always wanted to teach, but never “had time for” in the course of a normal, busy school year?
Programming, that’s what.
I used the program linked above to teach my students about variables. Not just the ones we use in Algebra where you discover their hidden secrets through an eldritch process of logical steps. I mean, we did those as well, obviously. But I wanted them to experience the other kind, that can be used to store data, act as a counter, and help control flow with boolean checks.
We also went over how to create conditional statements. If we set a variable to increment, then we can use an if-else statement (Sometimes nested) to have our sprites carry out different actions under different conditions.
At any rate, this project was one of my pre-algebra students’ favorites. They came up with such funny and creative projects, and in addition to coding these, they also had to practice creating and solving their own algebra equations.
I first got into scratch for the Harvard intro to computer science course on edX. I will link the project I did for that class in the sidebar Scratch menu.
Using the Formula for Volume to Engage Critical Thinking, Build Pattern Recognition Skills, and Strengthen Resilience

The ability to see mathematical patterns is one of the four main strands upon which IB Middle Years Programme students are assessed. This pattern-finding activity is one of my favorites, because it encourages them to extend their thinking past what they’ve been taught and to take risks by trying out their ideas.
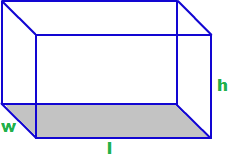
First, I make sure that they’re all comfortable with the formula for the volume of a rectangular prism, as well as the formulas for the areas of circles and triangles. The goal here is to get them to see that all volume formulas for prisms (and cylinders) have the same basic setup: you find the area of its base, and then you multiply that by the height.
This may seem obvious to people who already have this content in their mental databases. But let me assure you–it is NOT obvious to most students to whom I assign this task. What task? Well, this one:
1) So you know how to find the volume of a rectangular prism. Go ahead and tell me how you do that.
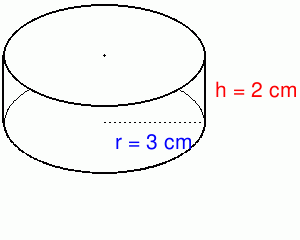
2) Now you’re going to use what you know about finding the volume of rectangular prisms and apply it to a cylinder. How would you find the volume of this cylinder? Please use a combination of math and writing to explain.
For rectangular prisms, some of the students just plug in the numbers and multiply. No matter how many times I may have emphasized that volume is the area of the base times the height. (I sometimes explain this as the number of rooms on the ground floor of a building times the number of stories it has is the total number of rooms–in other words, its volume.)
But they often don’t consider this. They have a system that works! Multiply those three numbers and they get it right! Why worry about the other stuff? So when they hit that cylinder question, many of them freak out–where is the third number?
This is where it’s important to have built into your classroom culture a feeling that it is not only okay to struggle, but that the struggle IS THE LEARNING. Students must understand that they aren’t expected to know this off the top of their heads. This isn’t regurgitation, and it isn’t even practice of a new skill. This is creating knowledge for yourself in a way that makes sense to you.
So. How do they know if their idea for the formula for volume of a cylinder is correct?
They don’t–yet. They write down their idea for what it might be, they do their calculations using their formula, and then I give them this task:
4) The volume of the cylinder below is about 502.4 cm3. Use this to test your formula. Does it work? If not, revise it. You may use a calculator for this section, but must show your work.
Giving students the answer allows them to try out their idea. If the formula they created doesn’t work–and they test it more than once to make sure it isn’t just a typo on their calculator–then they know that they need to go back to the drawing board and re-examine their thinking.
That’s a lot for 11-13-year-olds to handle sometimes, so it’s important at this stage to be their cheerleader. If by this point in the year they have heard you chant “Fail Forward!” and “FAIL=First Attempt In Learning!” then they are far less likely to put their head down on their desk and give up. I also bolster them with pointed questions.
“Notice how I shaded the base of that rectangular prism? Maybe that’s a hint.” or “How are a rectangular prism and a cylinder the same? What measurements do they both have?”
Eventually, everyone catches on. And the light in their eyes when they realize that they just taught themselves the formula for the volume of a cylinder is priceless. They not only see that their perseverance paid off, but they also learn to trust in the process of thinking, trying, revising, trying again. They learn that they are more capable than they previously thought.
Then, once their confidence is a little built up, I hit them with this:
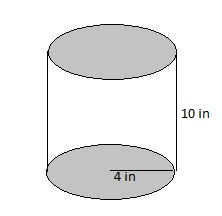
5) Now, apply what you know to a new situation. How would you find the volume of this triangular prism? Use a combination of math and writing to explain.
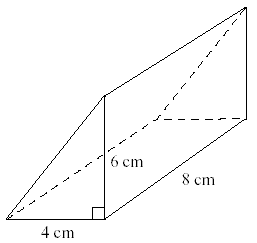
This one is tricky, because the “base” isn’t on the bottom. But it’s also great, because there are two ways students can visualize this to get to the right answer: they can either think in the same way as the previous two about how the area of the base (now a triangle) times the height is the volume. Or they can think, “Hey, this is just half a rectangular prism, so I’m going to take that formula and cut it in half.” Either way shows good critical thinking. I let them test their formula, of course:
7) The volume of this triangular prism is 173.25 cm3. Use this to test your formula. Does it work? If not, revise it. You should use a calculator for this section, but you must show your work.
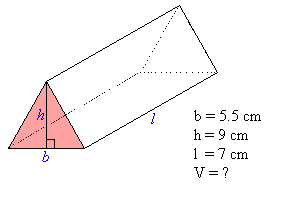
Same deal as before. But the additional difficulty is that they have to understand that b isn’t the AREA of the base. And h isn’t the height of the full prism, just of the base. More opportunities to force them to really think about their moves, here.
Finally, we want to tie it all together. I ask them to write me a little paragraph:
8) How are all the formulas for volume the same?
This one can be tricky even for those students who understood the math. Every now and then, they think that the answer is too easy, and it couldn’t possibly be the answer. However they handle it, I will usually look over their work as they hand it in, and return it if they don’t quite have a clear statement about their thinking.
To round out this lesson/exploration/assessment, I usually have the students share their own experience with each other. Lots of pride and relief all around, as well as an opportunity to see these equations through a different thought process.
And that’s it! This is one of my favorite power lessons, because it hits so many learning goals, not just in terms of math content, but in terms of emotional regulation and critical thinking. It takes a lot of stick-to-it-ness to get through this lesson, and I always emphasize to my students that they’re amazing for being the latest class to prove how awesome they are by honing the fine steel of their minds in the forges of struggle.
Where to Begin?
Many Projects
Public class HelloBlog {
public static void main(String[] args) {
SystemOut.println(“Hello, Blogverse!”);
}
}
“Princess Nell had to reconstruct them, learning the language, which was extremely pithy and made heavy use of parentheses.”
― Neal Stephenson, The Diamond Age
I learned something about myself last year. I really love to code.
So in my free time, I’m teaching myself to code in Java by taking a class through Coursera. It’s offered by Princeton, and is called “Computer Science: Programming with a Purpose.”
It’s great, and I’ve learned so much already it’s just nuts. It started, as it always does, with “Hello, World.”
Which had me spitting and sputtering in disbelief about how complicated that damn program was in Java compared to how easy it is in Python (which I am teaching myself through a book by No Starch Press called Crash Course Python). I resented every single bracket I had to type, and every single baffling turn of phrase and random punctuation mark.
But after a while, I started to feel a wee bit impressed with myself.
I am such a n00b at this stuff still, but the things I have managed to accomplish have made me really proud. I wrote a program to create a minesweeper grid. I wrote a program to draw the borders of every country in the world. I wrote a program recently (and this one made me tear my hair out for a week) that used bottom-up dynamic programming to return the coefficient T(n,k) of the (n+k) power of the trinomial expansion (1 + x + x2)n.
I’ve written programs that take .wav files and mix them, concatenate them, reverse them. I’ve written a program that calculates the Shannon entropy of a large stream of random data. And that’s just scratching the surface.
I like coding in Java so much now that it’s taken over as my main hobby. My poor novel, which I just finished plotting out, is starting to play second fiddle. I may even take more classes in Java specifically after this one, to just keep the language fresh and keep expanding my skills.
…Or maybe I’ll go back to Python, and see how much faster I can learn it now.
What You Can Find Here
I am a person of many interests. I teach math, and have strong opinions about how it should be done. I am interested in information security, and attend conferences. I like soldering. I like computer science, and have taken up coding in my spare time. Recently, I have become interested in networking, and have decided to start doing some reading about it.
I plan to use this space to share what I am learning in networking. I also plan to use this space to share some of the math lessons I am particularly proud of, as well as some of the programs I write as I teach myself to code.
There may be some blinky soldering projects, too.
